|
The JOURNAL of APPLIED RESEARCH In Clinical and Experimental Therapeutics |
 |
| Current Issue |
| Previous Issues |
| Reprint Information |
| Back to The Journal of Applied Research |
Optical Methods for
Diagnosis of Neoplastic Processes in the Uterine Cervix and Vulva
Natalia M. Shakhova MD, PhD*
Veronika V. Sapozhnikova, PhD*
Vladislav A. Kamensky, PhD*
Roman V. Kuranov*
Viktor B. Losheno, PhD
Svetlana A. Petrova, MD
Aleksey V. Myakov*§
*Institute
of applied physics of
§Spectroscopy
Laboratory, Universaty of
Grant sponsor:
KEY WORDS: 5-aminolevulinic acid
(5-ALA), cancer, cervix, fluorescence spectroscopy, optical coherence
tomography
ABSTRACT
Background and Objective: The goal of this paper is to perform a comparative study of the capabilities of optical coherence tomography (OCT) and fluorescence spectroscopy for detection of neoplastic processes and malignant tumor borders in the uterine cervix and vulva, and to preliminarily analyze the advisability of using these two methods complementarily.
Study Design/Materials and Methods:
Using the two methods-fluorescence spectroscopy, which is based on the detection of biochemical changes in tissue, and optical coherence tomography that detects morphologic or structural tissue information-borders of neoplasia in the uterine cervix and vulva were determined. A parallel analysis of optical properties of tissue and histologic material taken from the center of tumor and the OCT-detected boundary was performed; the visual and optically detected borders of the pathological zone were compared. A total of 12 women with neoplasia in the uterine cervix and vulva were enrolled in this study.
Results: First results of this study show that an optically detected demarcation line of cervical neoplasia is farther from the tumor focus by an average of 2 mm than a colposcopically determined border. It was verified that the OCT-detected borders morphologically coincided with the real histologic borders. The OCT and fluorescence spectroscopy yielded the same results in only some experiments. In several clinical cases, it was difficult to interpret OCT images (combination with scar changes in the uterine cervix) and fluorescence spectroscopy data (combination with inflammatory changes).
Conclusions: Experimental
data presented here show the capability of OCT imaging and fluorescence
spectroscopy to detect borders of neoplastic processes in the uterine
cervix and vulva more accurately than conventional colposcopy. The results
of this study provide a rationale for using these optical techniques
in combination as complementary objective methods of cancer diagnostics.
Introduction
Because cervical cancer holds a leading place in the spectrum of oncologic diseases, the problem of its diagnosis is of high importance. According to the National Cancer Institute, 12,800 cases of invasive cancer of the uterine cervix were diagnosed and 4,800 women died of this disease in the United States in 1999.1 Importantly, the death rate can be considerably reduced if cervical cancer is detected in the early stages. The traditional method for cervical cancer diagnosis is colposcopy and colposcopically guided biopsy. However, different authors report false-negative rates for colposcopically guided biopsy that vary from 15% to as high as 56%.2,3 This high rate is probably due to difficulties in interpreting the colposcopic findings and insufficient experience for personnel.4
Early diagnosis of cancer of the uterine cervix and vulva is essential not only for reducing the death rate but also for facilitating organ-preserving treatment, because this pathology increasingly affects women of reproductive age. The success of organ-preserving surgery depends crucially on the correct estimate of the extent of pathologic process.5 Accurate estimation of tumor size would allow clinicians to decrease recurrence rate, which is caused predominantly by insufficient excision volume, and at the same time, to keep excision volume minimal and preserve the organ.6 In other words, to provide organ-preserving but adequate treatment, one msut know accurate borders of tumor and effective new ways of diagnosing uterine, cervical, and vulva neoplasia are highly desired.
In the early 1940s, scientists studied the capability of tumor cells to accumulate fluorescent markers. Several groups reported on the ability of malignant tissues to accumulate porphyrins and related compounds and suggested using this feature of tumor tissues for cancer diagnostics. These studies were the starting point for applying fluorescence methods using exogenous fluorophores to visualize neoplasia and the demarcation of tumor borders. Currently, optical methods are widely used among other diagnostic technologies to detect uterine cervical neoplasia. The model studies also show the possibility of fluorescence analysis to detect biochemical changes typical for neoplasia long before the characteristic morphologic alterations occur.7
Recently, in vivo laser-induced fluorescent methods (LIFS) with exogenously introduced fluorescence agents were investigated. When interacting with neoplastic cells, fluorescent markers increase a quantum yield of luminescence, thereby providing fluorescence contrast of cancerous tissue against the healthy background. Presently, systemic administration of 5-aminolevulinic acid (5-ALA) is considered to provide the best perspective. This agent induces accumulation of endogenous photosensitive porphyrins, especially protoporphyrin IX, and begins a series of metabolic reactions in living tissue, modulating the fluorescence of porphyrins.8,9 Multiple studies show good prospects for fluorescence spectroscopy as a diagnostic method for cervical neoplasia.1012 At the same time, limitations of this method are also investigated. These limitations are related to the influence of inflammatory changes on the specificity of fluorescence spectroscopy and the ability to detect biochemical rather than structural alterations in superficial layers of the epithelium only, among other things.3,13
Presently, ultraviolet lasers are used worldwide to excite fluorescence. The fluorescence is observed in the blue, green, and red spectral regions. In the blue and green part of the spectrum, fluorescence originates mostly from reductive-oxidative ferments of cellular metabolism: flavoproteids and nicotinamid adenine dinucleotides. This makes it possible to quantitatively assess the intensity of metabolic processes in tissue using fluorescence spectroscopy. In the red region, fluorescence of porphyrins starts dominating, and their amount and, thus, amount of fluorescence, increases with malignance. Using the red/blue-green fluorescence spectra ratios, the degree of malignancy of the process can be determined. However, laser radiation at wavelengths of 300 to 500 nm penetrates at depths of 0.3 mm.14,15 Therefore, the technique is limited to exophitic forms of cancer only. In addition to flavins and NAPH, there are other endogenous fluorophores that make a considerable contribution in the green part of the spectrum, changing the fluorescence spectrum at the wavelength of 400 to 550 nm (oxidized hemoglobin). The use of fluorescence spectroscopy based on a He-Ne laser at a wavelength of 600 to 900 nm and exogenous dyes like protoporphyrin IX can, to our mind, minimize the limitations of the method.
The history of optical coherence tomography (OCT) application in medical diagnosis goes back to the studies performed by Huang et al.16 Furthermore, different research groups obtained in vivo images of highly scattering biotissues at a depth of 1.5 to 2 mm with spatial resolution close to the cellular level. OCT imaging has been performed in the skin, teeth, cerebral cortex, cartilage, bones, and nerves.17,18 Mucous membranes of internal organs have attracted considerable attention as a promising application area of OCT. In vivo OCT studies of mucosae became possible only after creation of fiber OCT devices compatible with working channels of endoscopes.18,19 These studies showed that OCT is most informative for tissues covered with stratified squamous epithelium, being able to detect morphologic alterations typical of such pathologic processes as inflammation, tumors, and tumor-like lesions.
Our research team has an approximately 10-year experience of using the technique of optical coherence tomography. In previous studies, we determined the OCT criteria for normal and pathologically altered tissues of different human organs and demonstrated good prospects for using OCT in clinical practice for guided biopsy, staging malignant tumors according to their linear size, and monitoring organ-preserving surgery.20,21 Also, the limitations of this method were shown, and ways of enhancing the diagnostic accuracy of OCT imaging were suggested.22
Currently, new technologies relying on a complementary investigation of different optical parameters of biotissues are suggested to increase the diagnostic value of optical methods.3,13,23
We propose using a combination of OCT and fluorescence
spectroscopy to study both biochemical and morphologic characteristics
of biotissue. The goal of this paper is to compare the possibilities
of fluorescence spectroscopy and OCT imaging for visualizing the extension
borders of malignant tumors, taking, as an example, neoplastic processes
in the uterine cervix and vulva. A further goals of this study is to
perform a preliminary analysis of the advisability of the complementary
use of these optical methods.
Materials and Methods
Patients
Women with diagnoses of severe dysplasia and microinvasive and invasive cancer of the uterine cervix and vulva were enrolled in the study. A total of 12 patients were involved, ranging in age from 24 to 62 years (average, 45 years). Histology revealed invasive cancer in eight patients, including one case of vulva cancer; microinvasive cancer of the uterine cervix in three patients; and severe dysplasia of the uterine cervix in one patient. In vulval cancer, optical studies were performed 6 months after radiation therapy. The studies were performed in accordance with the Institutional Review Board (IRB) of the Regional Hospital, and informed consent was obtained from each patient.
Histology
Biopsy material was analyzed after standard processing and H&E staining. The diagnosis was verified by two experienced independent pathologists.
Fluorescence Spectroscopy Setup
Fluorescence in the red part of the spectrum induced by protoporphyrins is quite important for malignant tumors from a biological standpoint. The use of He-Ne lasers with an exciting wavelength of 632.8 nm and luminescent drugs enables diagnosis of malignant lesions at depths of 1 to 2 mm. To measure and analyze fluorescence of biological tissues in situ, we employed an electron-spectral laser setup LESA-01-BIOSPEC (Moscow, Russia) designed for fluorescent diagnostics of tumors and control of photodynamic cancer therapy (Fig. 1). The fluorescent diagnostics complex comprises a laser source LHN633-25-BIOSPEC (wavelength 633 nm, radiation power ranging from 0 to 12 MW) and a universal spectrometer with spectral range of measurement 500900 nm. Laser light is delivered through a flexible illumination fiber to an object of interest (Fig. 1). Tissue fluorescence induced by the laser light and elastically backscattered light are collected by a fiber optic catheter (FOC). Then radiation goes through a set of optical filters, which are used to bring the strong elastically reflected and fluorescence components to the same linear scale. The polychromator is used as a dispersive element in our setup (P). The backscattered light and fluorescence signal are fed to a spectrograph (S). Then the radiation intensity is registered by a photodetecting device, a photodiode ruler (1,024 channels) that measures spectral distributions of luminous fluxes within a wide range of wavelengths. For registration and initial data preprocessing, a multichannel optical spectrum analyzer MOSA (Interunis, Moscow, Russia) is employed. Further processing of measured spectra is performed using computer software. All experimental spectra are normalized to maximum reflection of laser radiation at 633 nm. At the first stage of experimental data processing, the fluorescence coefficient of tissue (Fc) is calculated. The intensity of fluorescence signal was defined as the ratio of an area below the spectral curve between 675 to 715 nm (S1) (the wavelengths correspond to fluorescence signal of protoporphyrin IX) to an area below the curve of diffusely scattered laser radiation at 620640 nm (S2). Therefore, the fluorescence coefficient can be written as:
Fc= S1/ S2 (1)
The fluorescence coefficient was determined in real time, and further contrast coefficient (Cc), which is defined as a ratio of fluorescence signal intensity at the previously determined wavelengths 675 to 715 nm in pathologic tissue to the fluorescence signal intensity in surrounding healthy tissue, was calculated.
Fluorescence measurements (Fc) were taken from at least 10 different pathologically nonaltered tissue regions, and then these spectra were averaged. This procedure eliminates site-to-site variation of fluorescence, and the resultant spectra contain the fluorescence signatures specific for certain individuals. Values of the fluorescence coefficient of healthy uterine cervix regions in different women varied from 0.3 to 0.5. The contrast coefficient (Cc) was determined as a ratio of Fci of pathological regions to Fcn of normal surrounding tissue; thus, Cc of pathologically non-altered regions will vary near unity.
Cc= Fci/ Fcn (2)
The obtained coefficients (1) and (2) can be used to optimize the emission contrast between healthy and pathologically altered regions of tissue. Special data processing software was developed for calculating the above coefficients.
OCT Studies
The tomograph comprises a broadband near-infrared (IR) light source, a Michelson interferometer based on a single-mode polarization-maintaining optical fiber, electronic and optical systems for in-depth and lateral scanning (optical probe), a photodetector for interferometric signals, an electronic system for analog signal processing, and a computer for digital signal processing, real-time demonstration of images, and general control of the tomography. The superluminescent semiconductor diodes with a central wavelength of 1.3 mm and bandwidth of 30 to 50 nm were used as a light source. The parameters of the light source provided the spatial resolution of 10 to 15 mm and low output power of up to 10 mW. Therefore, the OCT imaging device with the above parameters and typical exposure time of several seconds can be considered noninvasive and has absolutely no side effects.
The distal end of the optical probe was placed in direct contact with tissue and held still to stabilize probe position and reduce artifacts caused by involuntary motion of the patient and operator. The image acquisition time of 3 seconds provided necessary averaging. The invisible probing ray was mixed with a red aiming ray with wavelength of 630 nm and power of 0.1 mW, which allowed precise localization of probing beam position on the tissue surface. The probe was calibrated using the calibration ruler, and the bar in OCT images corresponds to 1 mm. The magnitude of the OCT signal in tomograms is displayed by different gradation of gray color; lighter areas correspond to higher signal intensity.
Transversal scanning is performed by moving a tip of the optical fiber in front of the optical lens layout. As a result, the focused probing beam scans along the sample surface in the focal plane of the lens system. The means for transversal scanning is enclosed inside the metal sheath at the end of the sample arm of the interferometer. Varying the path-length difference between the sample and refernce arms of the interferometer attains in-depth scanning. The two-dimensional reflectivity map, OCT image or tomogram, obtained by scanning in-depth and along the tissue surface is recorded by a computer and stored for future processing. Typical acquisition time for a 200 X 200 pixel tomogram is 3 seconds.
The OCT scanning process is totally automated and computer controlled. The OCT device can be operated and images recorded using a personal computer (including portable computers) with a Pentium 200 MMX processor or higher.
Experimental Procedure
The standard clinical examination involved colposcopy using 3% acetic acid. The colposcope (Karl Zeiss, 150 FC) used in this study was equipped with a digital video camera, and each procedure was recorded. After the colposcopic data have been taken and evaluated, fluorescence spectra and OCT images were measured one after each other in real time. For averaging purposes, 5 fluorescence spectra and 3 tomograms were taken from each tissue site. At the end of the procedure, the sites of interest were biopsied for morphologic analysis.
The fluorescence analysis of living tissues in vivo was performed using 5-aminolevulinic acid (5-ALA) (NIOPIC, Moscow, Russia), the precursor of endogenous porphyrins. Freshly made crystalline ALA with a 15 mg/kg dose was dissolved in 200 ml of distilled water and administered per os. The study began 2.5 to 3 hours after the systemic administration of ALA. To minimize false-positive fluorescence associated with inflammatory changes, the patients vagina was sanitized with Betadine and mucosa was treated with a 3% hydrogen peroxide solution to remove mucus and reduce background bacterial fluorescence.
The OCT and fluorescence spectroscopy measurements were performed one by one, and the same sites of healthy and pathologically altered tissue sequentially, from the tumor center to its periphery with a step of 1 mm.
Optical criteria for a tumor border are (1) decrease in the fluorescent signal intensity to that of normal tissues, and (2) appearance of a layered tissue structure in OCT images.
Optical findings were compared with results of histologic analysis of biopsy material. Although optical measurements in each patient were made in 1 or 2 directions (total 17 measurements). Only two biopsies were taken in one direction for morphologic evaluation of the tumor focus and optical border. In one study, a visually detected border was biopsied and morphologically verified. When fluorescence and OCT borders did not coincide, biopsy was taken from the OCT-detected transition zone. Decision on the site of biopsy was made based on the fact that fluorescence spectroscopy reveals biochemical processes in tissue, whereas OCT visualizes early morphologic changes. Optical measurements and histological investigation were analyzed and compared. The results are summarized in Table 1.
Results
The OCT images obtained in this study clearly demonstrate the feasibility of OCT to detect structural tissue alterations in the uterine cervix caused by neoplasia development. The control tomograms from healthy regions of the uterine cervix show a well-organized layered structure. An upper layer corresponding to the epithelium appears in OCT images moderately scattering. The epithelium thickness is correlated with phase of the menstrual cycle and depends on the patients age. The connective tissue stroma is characterized by a higher backscattering coefficient. The border between epithelium and stroma, which morphologically corresponds with the basement membrane, is well pronounced and even. The informative OCT imaging depth averages 1.2 mm, and signal decays uniformly (Fig. 2). The OCT criterion for neoplastic processes is a loss of structural layered organization of the optical image in combination with intense scattering from upper layers of tissue and shallow imaging depth (Fig. 2). Due to the OCT ability to detect the transition of a structured image into a structureless one, it was possible to precisely visualize tumor borders (Fig. 2) that further were confirmed histologically (Fig. 2). OCT imaging of near-border regions indicates thickening of the epithelium, as compared to the control tomograms of normal tissues, which we believe morphologically corresponds to the hyperplastic epithelium. An optical pattern of non-altered epithelium which is typical for healthy uterine cervix regions can be found only at a distance of 5 to 7 mm from the visual colposcopically-determined tumor border (Fig. 2). Results of histological investigation are not available for this case because there were no indications for taking a biopsy and morphological verification of this region was not performed.
The systematic discrepancy between visual and OCT borders was observed. The OCT-detected border was found to be farther from the tumor focus than the visual border by a distance ranging from 1 to 4 mm. This is in agreement with the results obtained in our previous studies.24 Morphologic verification showed that in 6 cases the OCT-detected borders coincided with histological ones, that is with real borders of the tumor. As far as the visually detected border is concerned, in one study a morphologic analysis of this region revealed changes similar to those in tumor focus (Fig. 2).
Analysis of fluorescence spectroscopy data yielded the following results. Healthy tissue is characterized by fluorescence spectra with a minimal peak at a wavelength of 675 nm and no peak at a wavelength of about 700 to 705 nm corresponding to the fluorescence spectrum of protoporphyrin IX (PpIX) (Fig. 3). Fluorescence spectra obtained from tumor focus had a two-peak form typical for porphyrins at wavelengths of 675 nm and about 700 nm. To assess fluorescence numerically, the fluorescence coefficients (Fc) (1) of healthy and pathologically altered regions were calculated. According to our computations, Fc of healthy tissue varies from 0.3 to 0.5, for neoplasia it ranges more widely from 1.3 to 5.4 depending on the stage of the malignant process. Further we computed the contrast coefficient Cc given by (2). Figure 4 shows the Cc for a patient. Histograms depict the distribution of porphyrins accumulated in tissue and measured in the direction from tumor center to periphery.
At the tumor border, where neoplasia transforms into healthy tissue, there is a gradient in the concentration of PpIX, which manifests in a decrease in the intensity of fluorescence signal at corresponding wavelengths. Our studies show that the drop in the fluorescence coefficient PpIX to normal values corresponding to healthy tissue occurred at the distance of 1 mm to 3 mm from the colposcopic border.
Thus, our studies demonstrate that visual evaluation of borders of pathological lesions formed by neoplastic processes is inaccurate. As it was mentioned earlier, histology taken from a colposcopic border showed carcinoma identical to that in the tumor center. Importantly OCT images of tissue regions corresponding to the visual borders were structureless, and the fluorescence signal was much higher than that originating from surrounding healthy tissue.
In 13 cases, OCT-detected borders were 1 to 4 mm farther from the tumor focus than visual borders; and in 6 cases they were morphologically verified as real. As for the fluorescence method, in 7 of 17 cases a coincidence of OCT and fluorescent borders was observed, and in other 4 cases the discrepancy could be considered minimal and was up to 1 mm.
In two cases, the fluorescent signal decreased to the normal level corresponding to healthy tissue at a distance of 4 mm from the visual border (Table 1). Meanwhile, OCT images revealed the layered structure of tissue 2 mm far from the visual border, and morphological analysis showed benign changes in the epithelium with signs of inflammation. Thus, these observations may be referred to as examples of false-positive fluorescence spectroscopy results. Of certain interest are two cases in which the fluorescence border was found to be closer to the visual border than the OCT demarcation line. This was due to specific morphologic changes near the tumor border accompanying such crude processes as acanthosis and ulceral erosion of uterine cervix. It is known that these changes, being benign, considerably alter OCT images, making them almost structureless. Therefore, these observations can be considered as examples of false-positive OCT results.
In one case of invasive vulval cancer, the neoplastic border was not detected with OCT. OCT images in this case were structureless from the tumor center to periphery at a distance of 10 mm from the pathological focus, which we associate with scar changes after radiation therapy undertaken 6 months before our study. However, fluorescence spectroscopy showed the decrease in fluorescent signal intensity 5 mm from the visual border. The visual, optical and morphological borders coincided in 2 cases in our study of exophitic formations. We believe that this was not an artifact. We attribute this result to the character of growth of this tumor type.
Discussion
The successful application of OCT imaging in oncogynecology is determined by two factors: physical parameters of the OCT modality and structural features of the epithelium of female genital organs. Due to different scattering properties of the epithelium and stroma, vertical layer stratification and the position of the basement membrane are clearly displayed in OCT images of healthy tissues. Conversely, neoplastic processes at the early stages appear to destroy the internal layered structure of biotissues and lead to changes in optical properties that can be visualized by OCT. Along with the structural alterations, tissue undergoes drastic biochemical changes. The latter are characterized by intense synthesis of protoporphyrin IX (PpIX), which in turn can be detected by fluorescence spectroscopy. Therefore, methods of OCT and fluorescence spectroscopy can provide independent information on the pathological tissue state.
The advisability of using optical methods such as OCT and fluorescence spectroscopy in combination for diagnosis of neoplastic processes of the uterine cervix and vulva is evident. It is known that the tumor zone is characterized by cellular polymorphism; the malignization process proceeds non-uniformly, which makes visual evaluation of real dimensions of a pathologically altered regions challenging.26 This eventually leads to a higher rate of false-negative diagnosis,2,3 inadequate resection of a tumor during organ-preserving surgery, and, as a result, to tumor recurrence.6 The reported discrepancy between visual and morphological tumor borders justifies using of complementary optical methods for demarcation of malignant tumors.
The endophytic type of tumor growth is more difficult to diagnose than the exophytic one. This explains the choice of wavelengths employed for the fluorescence spectroscopy study. The red part of the spectrum penetrates quite deep and enables detection of visually hidden tumors of endophytic growth character at depths up 12 mm. This is an advantage over the widely used blue-green fluorescent diagnostics, which is able to detect only exophytic cancers.25 Another advantage is that the majority of natural chromophores are optically transparent at wavelengths of 600 to 900 nm, and the use of this radiation minimizes their background fluorescence. Since red LIFS with 5-ALA is employed, the variation of tissue fluorescence intensity from patient to patient can be avoided.15
The results obtained in this study can only be considered preliminary, because the number of patients is not sufficient for estimation of statistical significance. In this paper, we present preliminary analysis of the capabilities of optical methods applied to a particular clinical task-detection of tumor borders. These first results demonstrate that optical modalities can more precisely detect the demarcation line of malignant tumors in the uterine cervix, as compared with conventional colposcopy. The coincidence between an OCT-detected border and a morphologically verified border offers good prospects for application of OCT imaging in the diagnosis of cervical neoplasia. The example discussed above showed that interpretation of OCT images of uterine cervix tissue with scar changes could be quite difficult; this is one of the limitations of this method. They are closely connected with the fact that OCT spatial resolution allows visualization of tissue layers rather than individual cells. The fluorescence analysis lacks specificity regarding inflammatory changes, which leads to a high rate of false-positive results.15 The lack of full correlation between results of OCT and fluorescence spectroscopy shown in our paper, on the one hand, is related to the practical limitations, which are unavoidable at this early stage of the technological development. On the other hand, this proves that the methods are not interchangeable. Providing information on quite different optical properties of tissue, they act in a complementary manner. We believe that the complementary use of OCT imaging and fluorescence spectroscopy would minimize limitations of each method separately and enhance the diagnostic accuracy of optical diagnostics in general. In future, we plan to carry out extensive clinical trials and study this problem more thoroughly.
CONCLUSION
The results reported here show that OCT imaging and fluorescence spectroscopy can be used to detect borders of neoplasia in the uterine cervix and vulva more accurately as compared with colposcopy. Therefore, a combination of these optical modalities can provide an additional tool for malignant tumor diagnostics and border detection.
References
1. MedPro Month: US Market for Diagnostic Oncology Products. Medical Technologies July 2000.
2. Hopman EH, Kenemans P, Helmerhorst ThJM: Positive predictive rate of colposcopic examination of the cervix uteri: An overview of literature. Obstet Gynecol Surv 53:97106, 1998.
3. Nordstrom RJ, Burke L, Niloff JM, Myrtle JF: Identification of cervical intraepithelial neoplasia (CIN) using UF-excited fluorescence and diffuse-reflectance tissue spectroscopy. Lasers Surg Med 29:11827, 2001.
4. Shingleton HM, Orr JW: Cancer of the cervix. Philadelphia: J.B. Lippincott.1995.
5. Creasman WT, Zaino RJ, Major FJ: Early invasive carcinoma of the cervix (3 to 5 mm invasion): Risk factors and prognosis. A gynecologic oncology group study. Am J Obstet Gynecol 178:624, 1998.
6. Gonzalez CDI, Zahn CM, Retzloff MMG, et al: Recurrence of dysplasia after loop electrosurgical excision procedure with long-term follow-up. Am J Obstet Gynecol 184:31521, 2001.
7. Coghlan L, Utzinger U, Richards-Kortum R, et al: Fluorescence spectroscopy of epithelial tissue throughout the dysplasia-carcinoma sequence in an animal model: Spectroscopic changes precede morphologic changes. Lasers Surg Med 29:110, 2001.
8. Stratonnikov AA, Loshchenov VB, Klimov DV, et al: The spectral fluorescent properties of tissues in vivo with excitation in the red wavelenghth range. SPIE 3197:119130, 1997;
9. Tuchin VV: Laseri I volokonnaja optika v biomedicinskih issledovanijah. Saratov: Saratovskii Universitet 382, 1998.
10. Brookner C, Utzinger U, Staerkel G, et al: Cervical fluorescence of normal women. Lasers Surg Med 24:2937, 1999.
11. Follen M, Cantor M, Ramanujam N, et al: Fluorescence spectroscopy for diagnosis of squamous intraepithelial lesions of the cervix. Obstet Gynecol 93:462470, 1998.
12. Hillemanns P, Weingandt H, Baumgartner R, et al: Photodetection of cervical intraepithelial neoplasia using 5-aminolevulinicic acid-induced porphyrin fluorescence. Cancer 88:22752282, 2000.
13. Agrawal A, Utzinger U, Brookner C, et al: Fluorescence spectroscopy of cervix: Influence of acetic acid, cervical mucus and vaginal medications. Lasers Surg Med 25:237249, 1999.
14. Leuning A, Mehlmann M, Betz C, et al: Fluorescence staining of oral cancer using a topical application of 5-aminolevulinicic acid: Fluorescence microscopic studies. J Photochem Photobiol 60:4449, 2001.
15. Betz CS, Mehlmann M, Rick K, et al: Autofluorescence imaging and spectroscopy of normal and malignant mucosa in patient with head and neck cancer. Lasers Surg Med 25:323334, 1999.
16. Huang D, Swanson EA, Lin CP, et al: Optical coherence tomography. Science 254:11781184, 1999.
17. Welzel J, Lankenau E, Birngruber R, Engelhardt R: Optical coherence tomography of the human skin. J Am Acad Dermatol 37:95863, 1997.
18. Fujimoto JG, Boppart SA, Tearney GJ, et al: High resolution in vivo intra-arterial imaging with optical coherence tomography. Heart 82:128133, 1999.
19. Sergeev AM, Gelikonov VM, Gelikonov GV, et al: In vivo endoscopic OCT imaging of precancer and cancer states of human mucosa. Optic Express 1:432440, 1997.
20. Zuccaro G, Gladkova N, Vargo JJ, et al: Optical coherence tomography (OCT) in the diagnosis of Barretts esophagus (BE), high grade dysplasia (HGD), intramucosal adenocarcinoma (ImAC) and invasive adenocarcinoma (InvAC). Gastrointest Endosc 53:330, 2001.
21. Shakhov AV, Terentjeva AB, Kamensky VA, et al: Optical coherence tomography monitoring for laser surgery of laryngeal carcinoma. J Surg Oncol 77:253258, 2001.
22. Shakhova NM, Gelikonov VM, Kamensky VA, et al: Clinical aspects of the endoscopic optical coherence tomography and the ways for improving its diagnostic value. Laser Physics 12:617626,2002.
23. Kuranov RV, Sapozhnikova VV, Turchin IV, et al: Complementary use of cross-polarization and standard OCT for differential diagnosis of pathological tissues. Optics Express 10:707713, 2001.
24. Kuznetzova IA, Shakhova NM, Kachalina TS, et al: Optical coherence tomography in diagnosis of cervical cancer. Proc SPIE 3907:440447, 2001.
25. Nikas DC, Foley JW, Black PM: Fluorescent imaging in a glioma model in vivo. Lasers Surg Med 29:1117, 2001.
26. Hmelnizkiy OK: Pathomorphologicheskaya diagnostika
ginecologicheskih zabolevanii. Sankt-Petrburg 98, 1994.
Figure 1. Schematic of the experimental OCT setup:
SLD, superluminescent diode; FBS, polarization-maintaining fiber based
on 3dB beam splitter; PD, photo diode; SA, selective amplifier; LA,
logarithmic amplifier; AD, amplitude detector; ADC, analog to digital
converter; PC, personal computer. Schematic of the experimental fluorescence
spectroscopy device: F, optical filter; PH, polychromator; PDA, photodiode
array; STA, spectrum analyzer; PC, personal computer.
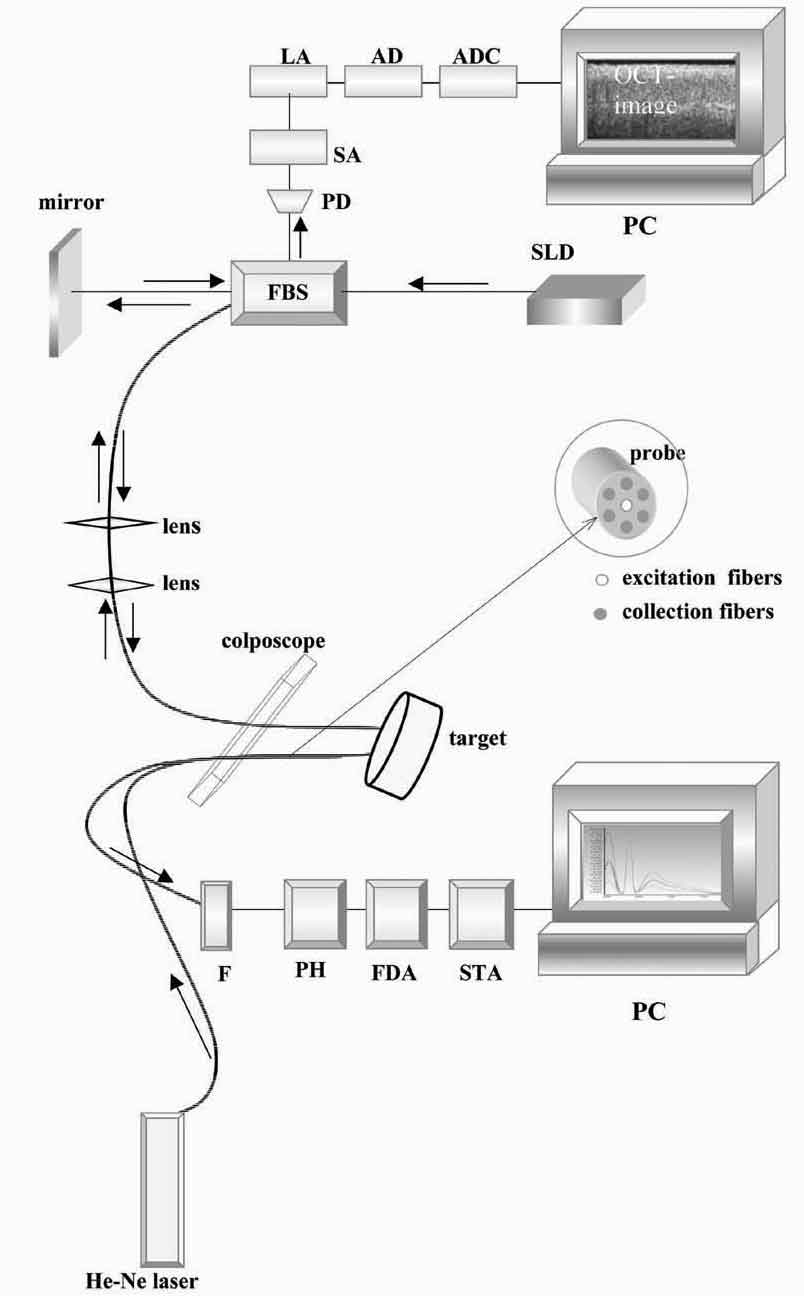
Figure 2. OCT images and histology (H&E) of
the same areas illustrating spreading of the neoplastic process in the
cervix: a) healthy cervix; b) center of the tumor; c) colposcopic border;
d) histology of squamous non-keratinizing cancer as shown in the OCT
image; e) OCT border of the tumor is 2 mm apart from the visual border
(healthy tissue on the left, neoplastic tissue on the right); f) histology
(H&E) corresponding to OCT image; g) normal tissue 5 mm from the
colposcopic border.
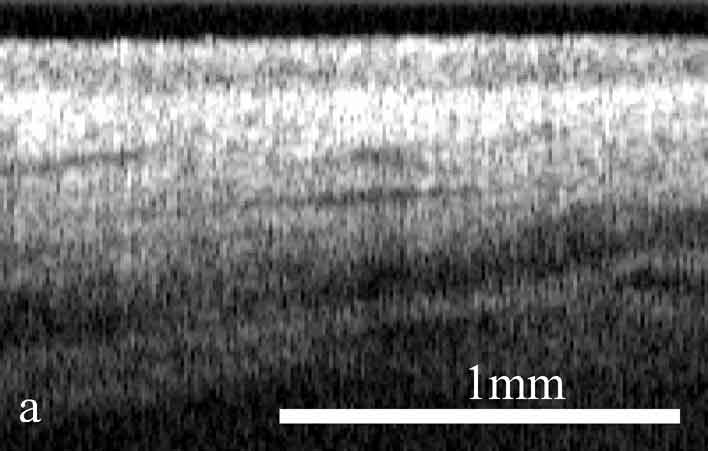
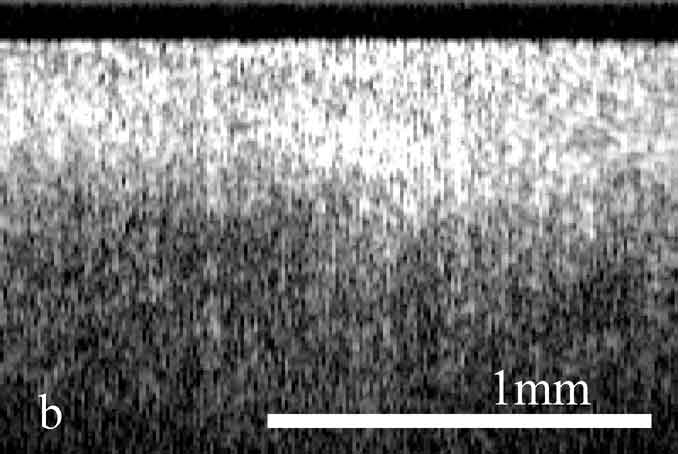
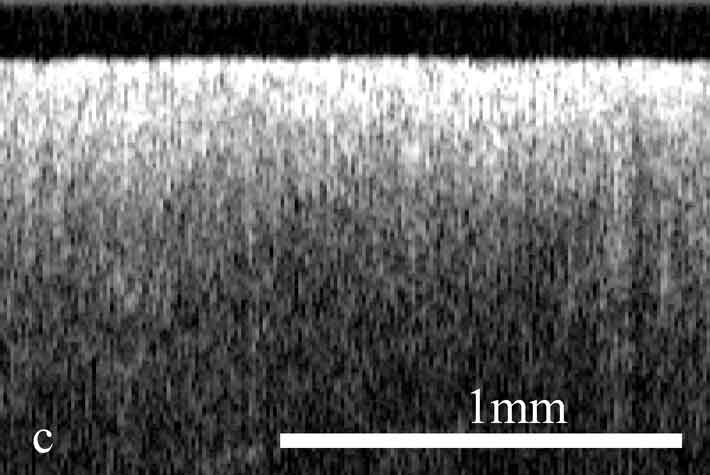
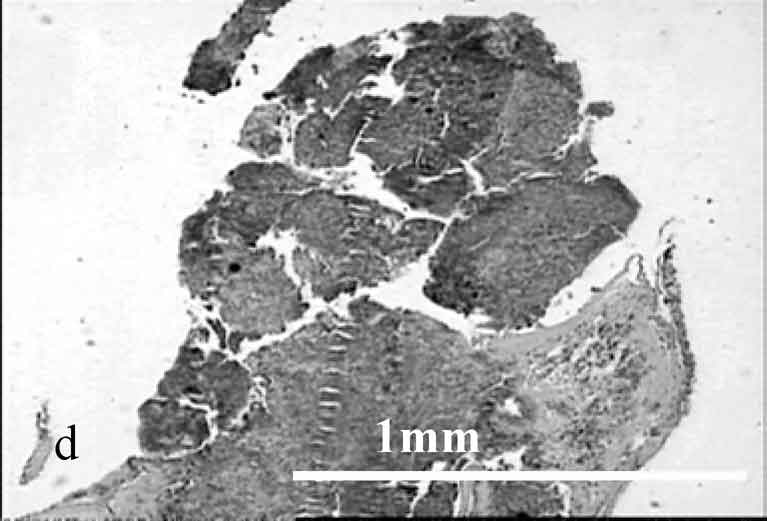
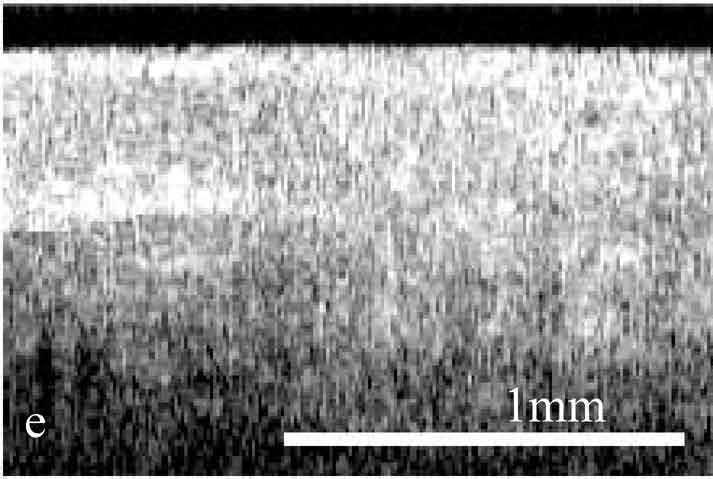
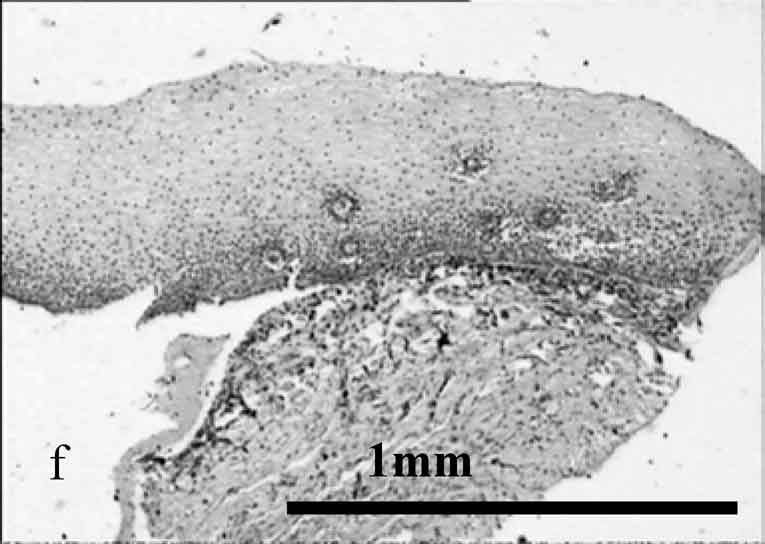
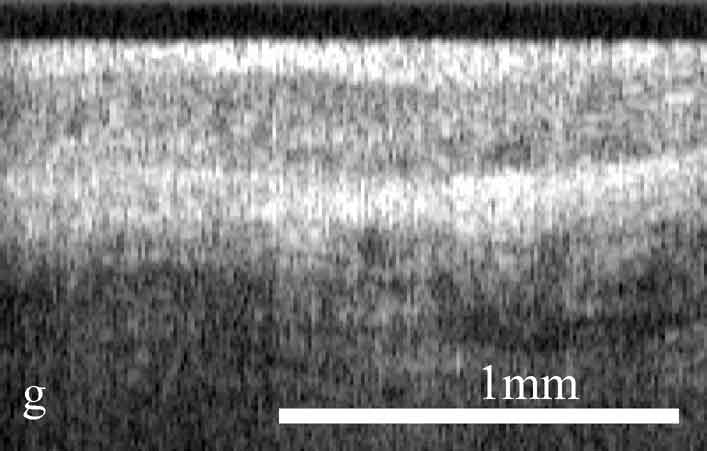
Figure 3. Fluorescent spectra of different sites
of healthy and pathological tissues. 1, focus of the tumor; 2, colposcopic
border of the tumor; 3, OCT border of the tumor 2 mm from the colposcopic
border of cancer; 4, healthy tissue 6 mm from the visual border of the
tumor.
Figure 4. Patient HZ47. Histogram
of the coefficient Cc versus distance from the tumor center for one
direction. The values of the coefficient Cc are maximal in the focus
of the tumor for this patient; at the visual border, the values of Cc
are 1.5 higher than those at the OCT border; at the distance of 2 mm,
Cc decreases to the values corresponding to normal tissue. * OCT border
of the tumor.
©2000-2013. All Rights Reserved. Veterinary Solutions LLC
2Checkout.com is an authorized retailer for The
Journal of Applied Research