|
The JOURNAL of APPLIED RESEARCH In Clinical and Experimental Therapeutics |
 |
| Current Issue |
| Previous Issues |
| Reprint Information |
| Back to The Journal of Applied Research |
ABSTRACT
Inherited impairment in drug metabolism is a common
cause for adverse drug reactions. Such impairment is linked to polymorphisms
on genes coding for enzymes related to drug biodisposition, and most
of these polymorphisms consist of single nucleotide polymorphisms
(SNPs). Recently developed genotyping techniques permit an accurate
and rapid detection of common SNPs that are relevant to clinical response
to several drugs, including those metabolized by diverse cytochrome
P450 enzymes and
N-acetyltransferase 2 (NAT2) enzyme. However, the clinical use of
genotyping kits is hampered by the high number of mutations present
in the genes coding for these enzymes. From a practical point of view,
it should be decided what SNPs should be analyzed for every polymorphic
gene to obtain an accurate phenotype prediction with a relatively
short number of SNP analyses. In this report, the predictive capacity
for seven SNPs affecting the coding region of the NAT2 gene are
analyzed for individuals from diverse ethnic origin. We conclude that
for Caucasian individuals the analysis of three SNPs is enough to
reach a 99.4% accuracy in the prediction
of slow-acetylation genes. Non-Caucasian individuals should be analyzed
for different SNPs to reach a high NAT2 phenotype prediction.
INTRODUCTION
Single nucleotide polymorphisms (SNPs) of the genes encoding drug-metabolizing enzymes are responsible for large interindividual variability in drug metabolism. These polymorphisms are a major cause of drug toxicity, drug-drug interactions, and lack of therapeutic effect. In the past several years several polymorphisms of drug-metabolizing enzymes have been described and typing tests have been developed for the in vivo evaluation of enzyme activities (phenotyping) or for the detection of mutations that cause impaired metabolism (genotyping). These tests are currently being used to prevent adverse drug reactions in patients who have inherited impairment in drug metabolism.
As the knowledge of the genetic basis for these polymorphisms increases, the identification of new defect alleles permits a more accurate prediction of the metabolic capacity. However, this might have a negative counterpart. As more mutations are analyzed, genotyping methods become more complex, time-consuming, and expensive. This is forcing scientists to decide where to set the equilibrium point between accuracy and feasibility in genotyping methodologies.
An excellent example for this increasing complexity is the Arylamine N-acetyltransferase 2 enzyme (NAT2; E.C. 2.3.1.5). The determination of NAT2 genotype or phenotype has been proposed to predict adverse reactions in patients with tuberculosis,1,2 and before the concomitant administration of procainamide and phenytoin.3
Initially two NAT2 allelic variants were described
(for a review, see reference 4). In the past several years the knowledge
of mutations related to impaired drug metabolism increased impressively,
and presently 20 different NAT2 allelic variants that consist of combinations
of seven point mutations are known to occur in humans.4–6 Most genotyping methodologies analyze genomic DNA by mutation-specific
amplification or amplification-restriction. With the use of these
methodologies, and with the newly developed genotyping kits based
on real-time PCR, two genes, one derived from the male parent and
the other from the female, are analyzed simultaneously. In the case
of NAT2, isolated SNPs are extremely rare; therefore, when two or
more SNPs are identified it is of major importance to know whether
these mutations are located in a single gene, the other one being
functional, or mutations are located in different genes, both genes
being defective. Table 1 shows the seven major SNPs affecting the
coding region of the NAT2 gene, and how these mutations are associated
in diverse allelic variants of the gene. Among them, mutations located
at positions 191, 282, 341, 590, and 857 are related to slow acetylation,
and therefore any allelic variant that contains one or more of these
mutations is considered a defect gene.4 The frequency for every allelic
variant was calculated from a compilation of 1034 Caucasian individuals
(2068 genes) analyzed in different NAT2 genotyping studies6–11
by the use of a genotyping methodology that permits the complete and
independent mapping of every single NAT2 gene.7
Predictive Capacity of
Point Mutation Analyses
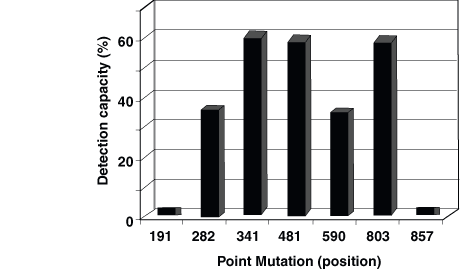
The allele frequencies shown in Table 1 indicate that SNPs at the NAT2 gene locus are at an extreme linkage disequilibrium, and that unexpected combinations of mutations are so rare that they do not justify the use of high-complexity analyses. The highest predictive capacity, (ie, the point mutation that is present in more defect genes) is that located at position 341. The analysis for such SNP identifies 60.9% of defect alleles, as shown in Figure 1. The SNP at position 481 shows almost identical predictive capacity (59.3%), and even the SNP at position 803, which is not related to the slow acetylation phenotype, shows a similar prediction capacity for defect genes.
Mutations at positions 282 and 590 predict 36.1% and 35.4% of defect genes, respectively, whereas the rest of the mutations, located at positions 191 and 857, have low predictive capacity: 1.4% and 1.5% of slow alleles, respectively. A careful evaluation of the frequency for rare allelic variants (ie, rare combinations of mutations), as well as the associated frequency of diverse combinations of point mutations, permits the design of a genotyping strategy that can lead to a high predictive capacity with a low cost.
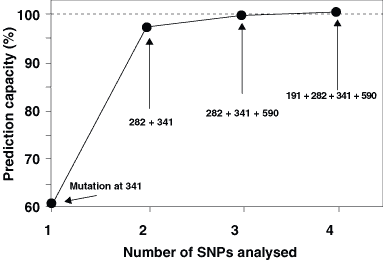
Mutations with a high capacity to detect defect genes should be analyzed first. Thus, one of these (341, 481, or 803) should be the first mutation to study. This would predict nearly 60% of defect alleles (Fig. 2). Because these three SNPs are at extreme linkage disequilibrium, when one of these has been analyzed, the study of the two other mutations adds little to the phenotype prediction. Instead, it is far more efficient to analyze the SNPs at positions 282 or 590. The mutation at 282 is never allocated in the same allele as mutation at 341 (Table 1); therefore, the analysis of the SNP at 282 in the second place, after the analysis of the SNP at 341, increases the predictive capacity up to 97% of defect genes. If more accuracy is required, the highest efficiency is achieved by adding the analysis of mutations at 590 that might occur as isolated mutation. This would give an efficiency for the identification of defect genes over 99.4%. The last SNP to be studied is that located at position 191, which is the rarest one in Caucasians and is almost always present in alleles that contain other inactivating mutations (Table 1).
It should be taken into consideration that analyses with a high predictive capacity are more time-consuming and more expensive than simplified analyses in which only two or three mutations are studied. High laboratory costs and time-consuming analyses can decrease the feasibility of routine genotyping analyses. Because the analysis of all seven mutations does not seem to be justified for most studies in which phenotype prediction is required, the study of mutations at positions 282 and 341 is likely to be a fair equilibrium point between accuracy and feasibility. Considering that individuals with one or two active genes show efficient acetylation capacity in vivo, and only individuals with two defect genes are classified as slow acetylators, with a two-mutation simplified genotyping, the efficiency of phenotype prediction would be nearly 99% of individuals.1 Figure 2 shows the prediction capacity for the detection of defect genes in combined mutation analyses, as calculated according to the actual frequencies for NAT2 genotypes in Caucasians.
Regarding non-Caucasian populations, the estimation of the phenotype prediction capacity of simplified analyses is shown in Table 2, and it is based on published data of NAT2 allele frequencies.4,12–14 For African-Americans and mixed Hispanic individuals the first mutation to be analyzed is that located at position 341, although the phenotype prediction capacity for single mutation analysis is lower as compared with Caucasians. The addition of analysis of the mutation at 282 increases the chances for a correct phenotype prediction, but it is necessary to also analyze the mutation at 191 to obtain a high predictive capacity. In Asian individuals single mutation analysis is enough to reach a high predictive capacity if the first SNP to be analyzed is that located at position 282. This is because such mutation is present in the most common defect alleles among Asian subjects, namely, NAT2*6 and NAT2*7.4 The addition of the analysis of the SNP at position 341 increases the phenotype prediction capacity to approximately 100%. These estimations should be considered approximate, because the occurrence of extremely rare allelic variants has not been completely studied in all these populations.
In summary it can be concluded that simplified genotyping analyses of only two or three mutations are enough to reach a high efficiency in the identification of defect NAT2 genes. These analyses can be carried out at a low cost and in a relatively short time. Besides NAT2, the actual impact of rare allelic variants should be carefully evaluated for other drug-metabolizing enzymes with clinically relevant polymorphisms, such as CYP2D6 and CYP2C9. Over 75 variant alleles have been described for CYP2D6 and 12 variant alleles have been described for CYP2C9. For an updated list of SNP and allelic variants for these and other genes related to drug metabolism, see http://www.imm.ki.se/CYPalleles/default.htm. The analysis of the predictive capacity for every SNP in the detection of defect gene is a necessary step to design genotyping methodologies that are feasible in clinical practice, keeping a high phenotype prediction capacity. These simplified methodologies would increase the chances for the clinical use of genotyping methods for polymorphic drug-metabolizing enzymes.
Acknowledgments
This work was partly supported by grants FIS00/0278 from Fondo de Investigación Sanitaria, Instituto de Salud Carlos III (Madrid, Spain), and IPR00C022 from Junta de Extremadura, (Mérida, Spain).
REFERENCES
1. Clark DWJ: Genetically determined variability in acetylation and oxidation. Drugs 38:2798–2802, 1985.
2. Evans DAP: Genetic factors in drug therapy. Clinical and Molecular Pharmacogenetics. Cambridge: Cambridge University Press; 1993.
3. Crook JE, Woosley RL, Leftwich RB, Natelson EA: Agranulocytosis during combined procainamide and phenytoin therapy. South Med J 72:1599–1601, 1979.
4. Meyer UA, Zanger UM: Molecular mechanisms of genetic polymorphisms of drug metabolism. Annu Rev Pharmacol Toxicol 37:269–296, 1997.
5. Vatsis KP, Weber WW, Bell DA, et al: Nomenclature for N-acetyltransferases. Pharmacogenetics 5:1–17, 1995.
6. Agúndez JA, Olivera M, Martinez C, Ladero JM, Benitez J: Identification and prevalence study of 17 allelic variants of the human NAT2 gene in a white population. Pharmacogenetics 6:423–428, 1996.
7. Martinez C, Agúndez JA, Olivera M, Martin R, Ladero JM, Benitez J: Lung cancer and mutations at the polymorphic NAT2 gene locus. Pharmacogenetics 5:207–214, 1995.
8. Agúndez JA, Menaya JG, Tejeda R, Lago F, Chaves M, Benitez J: Genetic analysis of the NAT2 and CYP2D6 polymorphisms in white patients with non-insulin-dependent diabetes mellitus. Pharmacogenetics 6:465–472, 1996.
9. Agúndez JA, Olivera M, Ladero JM, et al: Increased risk of hepatocellular carcinoma in NAT2-slow acetylators and CYP2D6-rapid metabolizers. Pharmacogenetics 6:501–512, 1996.
10. Agúndez JA, Martinez C, Olivera M, et al: Expression in human prostate of drug- and carcinogen-metabolizing enzymes: association with prostate cancer risk. Brit J Cancer 78:1361–1367, 1998.
11. Agúndez JA, Jimenez.Jimenez FJ, Luengo A, et al: Slow allotypic variants of the NAT2 gene and susceptibility to early-onset Parkinson´s disease. Neurology 51:1587–1592, 1998.
12. Lin HJ, Han C-Y, Lin BK, Hardy S: Ethnic distribution of slow acetylator mutations in the polymorphic N-acetyltransferase (NAT2) gene. Pharmacogenetics 4:125–134, 1994.
13. Bell DA, Taylor JA, Butler MA, et al: Genotype/phenotype discordance for human arylamine N-acetyltransferase (NAT2) reveals a new slow acetylator allele common in African-Americans. Carcinogenesis 14:1689-1692, 1993.
14. Martinez C, Agúndez JA, Olivera M, et al: Influence
of genetic admixture on polymorphisms of drug-metabolizing enzymes:
Analyses of mutations on NAT2 and CYP2E1 genes in a mixed Hispanic
population. Clin Pharmacol Ther 63:623-628, 1998.
Figure 1. Detection capacity for isolated NAT2 point mutation analyses. The data correspond
to the percentage of defect NAT2
genes that are identified by the study of every point mutation, as
calculated from the allele frequencies shown in Table 1.

Figure 2. Phenotype prediction capacity for combined NAT2 point mutation analyses. The data correspond to the percentage of defect NAT2 genes that are identified by the combined use of point mutations, as calculated from the allele frequencies shown in Table 1. The estimated cost is calculated for routine analysis and includes DNA purification and genetic tests for point mutations.

Table 1. Schematic depiction of NAT2 allelic variants and its frequency in 1034 Caucasian individuals*
Allele designation 191 282 341 481 590 803 857 Frequency (%)
NAT2*4 G C T C G A G 22.0
NAT2*5A C T 1.2
NAT2*5B C T G 43.1
NAT2*5C C G 0.7
NAT2*5D C 0.3
NAT2*5E C A 0.05
NAT2*6A T A 24.4
NAT2*6B A 1.8
NAT2*7A A not detected
NAT2*7B T A 1.2
NAT2*12A G 1.8
NAT2*12B T G 0.1
NAT2*12C T G 0.7
NAT2*14A A 0.4
NAT2*14B A T not detected
NAT2*14C A C T G 0.5
NAT2*14D A T A 0.1
NAT2*14E A G not detected
No designation A T G 0.05
Consequence for activity Decreased Decreased Decreased Normal Decreased Normal Decreased
*Different combination of seven point mutations at positions 191, 282, 341, 481, 590, 803 and 857 of the coding region of the human NAT2 gene. The consequence for every mutation on the acetylation status is shown at the bottom of the column. Allele frequencies correspond to compiled data from 1,034 Caucasian individuals.
Table 2. Phenotype prediction capacity for combined
mutation analyses in diverse
human populations*
Caucasians African Mixed
Population
(U.S.) Americans Hispanics Chinese Japanese
Single
mutation analysis 83.1% 71.9% 78.6% 94.4% 98.6%
(341) (341) (341) (282) (282)
Two
mutation analyses 99.0% 92.4% 95.6% 100% 100%
(282+341) (282+341) (282+341) (282+341) (282+341)
Three
mutation analyses 100% 100% 99.5%
(282+341+590) (191+282+341)
(282+341+590)
Four mutation analyses 100% (282+341+590+191)
*The phenotype prediction capacity
is expressed as the percentage of individuals correctly predicted
for acetylation phenotype. Values were calculated from published allele
frequencies, and the frequencies for the slow acetylation phenotype
in every population. The point mutations to be analyzed for every
population are shown in parenthesis.
©2000-2013. All Rights Reserved. Veterinary Solutions LLC
2Checkout.com is an authorized retailer for The
Journal of Applied Research